
The basic thesis and the reason of this blog are that the current historical period can and must be symbolized (among many possible) with what is defined in the indian mythology KaliYuga, an age (Yuga) of destruction and death dominated by the hindu demon Kali.
The sources of KaliYuga are those here defined as Global Dynamics Process (GDPs), processes at many and different levels of complexity that affect the entire planet. The GDPs had as precondition the social and scientific revolutions of 600s and 700s, began with the industrial revolution of 800s, were fully expanding during 900s and will become irreversible within this century.
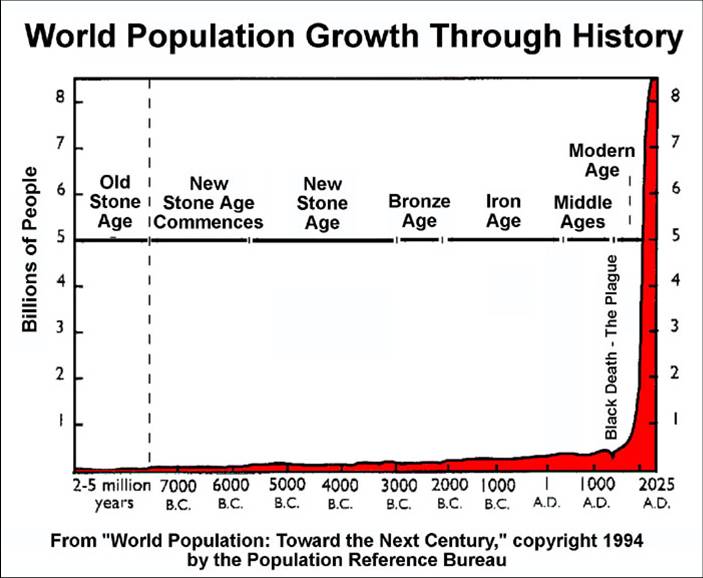
The three most important GDPs of KaliYuga, linked together, are the growth and global overpopulation, the depletion of environmental resources and the destruction of the earth ecosystem.
For a description of KaliYuga two instruments will be used here apparently antipodes as language and cultural context: the concept of Pattern that Connects proposed by Gregory Bateson in the 70's and the Tao Te Ching, the classic text that is regarded as one of the peaks of Chinese thought.
The Pattern which Connects is a meta-description (description of description) of meta-models (models of models) developed within the cybernetic and systemic movement after World War II, and one of the basic ideas for the subsequent development of second cybernetics and today's Science of Complexity.
As such it is considered to be the pinnacle of modern scientific thought.
The Tao Te Ching (Dao De Jing) is a short text of about 5000 characters composed of 81 chapters historically attributed to Lao Tzu, believed born around 570 BC, and his disciple Chuang Tzu. Actually it is considered that it was composed by at least five visionaries, including at least two women, in a period between 700 and 400 BC
It is to be regarded as one of the greatest gifts to humanity.
Millenarian myths of the end of the world are therefore becoming a reality. The responsibility lies with the so-called "men of power”, first of all priests and politicians, then of multinational executives, but the real blame belongs to those who gave them this power, therefore all of us.
The terrible paradox underlying this situation never occurred before in human history is that the knowledge, technologies and processes that are leading to the Kaliyuga are the same that could bring the planet to be a real paradise, but certainly not for the 6 billion people of today, while for the 10 billion of 2050 it will be a hell for sure.


 |
| Portion of the semantic network of this blog. |

 |
| Evolution of a dynamical system with high complexity - such human sociocultural-economical systems - in case of a crash ("crisis") of the system, proposed by Ervin László in 1986. Starting from the initial steady state from the left, characterized by fluctuations over an average level of its main parameters, the system experiences growing oscillations on its vital parameters and becomes unstable, due to the fact that its homeostatic mechanisms by negative feedback of compensation and stabilization in its subsystems cannot compensate positive feedback runaways. Following growing instabilities an onset of system crash may occurs, characterized by a fast and drastic reduction of the system parameters. It is to be noted that the onset of the crash is deterministic but of chaotic type, therefore unpredictable. The system evolution following the crash may be of five types: 1) direct destruction ("death") of the system; 2) indirect destruction of the system, due to the fact that it maintains the previous configuration but "try" on the basis of drastic negative feedbacks and resources investments to come back to the prior state, which is impossible because the global processes of positive runaway are over the point of no return and become irreversible; 3) system downgrade process: it maintains the previous configuration but drastically reduces the value of its life parameters to move in a new steady state characterized by a lower average level; 4) the system engages all the available resources to "recover" a new steady state but maintains the same configuration, therefore cannot surge to a new steady state and "falls short"; 5) the system besides engaging resources it reconfigure itself in its structure and "surge" toward a new stable level characterized by an higher average value compared to the previous one. (from: E. László, Evolution: the General Theory, 1987-1996), modified. |
 |
| 1. Pre-Industrial Phase [c. 3,000,000 BC to 1765: A = Tool making begins (c. 3,000,000 BC), B = Fire use begins (c. 1,000,000 BC), C = Neolithic Agricultural Revolution (c. 8,000 BC), D = Watt's steam engine, 1765 Interval D-E is a transition period. 2. Industrial Phase [1930 to 2025, estimated]: E = Industrial Civilization is defined to begin in 1930 when the leading-edge value of energy-use per person reached 37% of its peak value. F = Peak of Industrial Civilization, c. 1978: confirmed by historic data published by BP, IEA, USCB, UN, etc. G = World average energy-use per person continues to fall, 1996. H = Industrial Civilization is defined to end when energy-use per person shrinks to 37% of its peak value, forecast to occur by 2025. Life-expectancy (X) is estimated to be less than 100 years. Interval H-I is a transition period. 3. Post-Industrial Phase [c. 2100 and beyond]: J, K, and L = Recurring future attempts at industrialization fail. |
 |
| A very schematic view of the history of umanity; poorlydrawnlines |
 |
| Process amplitude of the Tao symbol computed as a function of its evolution for a unitary radius circle.The amplitude slowly increases for most of the evolution range, reaches its maximum value, then rapidly decreases to zero. At the same time, at the process maximum value, an opposite symmetrical process begins. |
 |
| Production per capita in terms of barrels of oil equivalent (boe: energy unit) per year from 1920 to (predicted) 2060 according to the Olduvai theory by R.C. Duncan (from the name of Olduvai gorge where traces of the first prehistoric technologies were found dated about 2.5 millions years ago and a site active for million of years). The conclusion is that the so-called Industrial Civilization will last no more than 100 years. Ref: R.C. Duncan, The Peak of World Oil Production and the Road to the Olduvai Gorge. Notes: (1) 1930; Industrial Civilization began when average energy-use per capita reached 30% of its peakvalue. (2) 1979; average energy-use per capita reached its peak value of 11.15 boe/c. (3) 1999; The end of cheap oil. (4) September 28, 2000; Start of the “Jerusalem Jihad”, the eruption of violence in the Middle East. (5) 2006; Predicted peak of world oil production. (6) 2008; The OPEC crossover event, when the 11 OPEC nations produce 51% of the world’s oil and control nearly 100% of the world’s oil exports. (7) 2012; Permanent blackouts occur worldwide. (8) 2030; Industrial Civilization ends when average energy-use per capita falls to its 1930 value. (9) Observe that there are three intervals of decline in the Olduvai schema: slope, slide and cliff — each steeper than the previous. |
 |
| Ref: J. Murray and D. King, "Climate policy: Oil's tipping point has passed", Nature, 25 January 2012. |
| Haldane | 1927 | "39 million years" |
| Russell | 1949 | "it cannot long continue" |
| Drake | 1961 | one million years |
| Watson | 1969 | potentially "millions of years" |
| Arrester | 1971 | natural response, about 200 years |
| Meadows, et al. | 1972 | natural response, 100-200 years |
| O'Neill | 1976 | "even our success becomes failure" |
| Leakey | 1977 | about 100 years |
| Harris | 1977 | "a bubble-like nature" |
| Crick | 1981 | short to 10,000 years or more |
| Laszlo | 1987 | "extremely short" to very long |
 |
| Distribution of global wealth range and total as percent of world population. Source: Credit Suisse Global Wealth Databook, 2011 |
 |
| Comparison of US GDP, total wages and national debt with the overall Wall St. turnover. The proportions are similar to that of Earth with the Sun. Source: WallStSalesTax, 2011 |
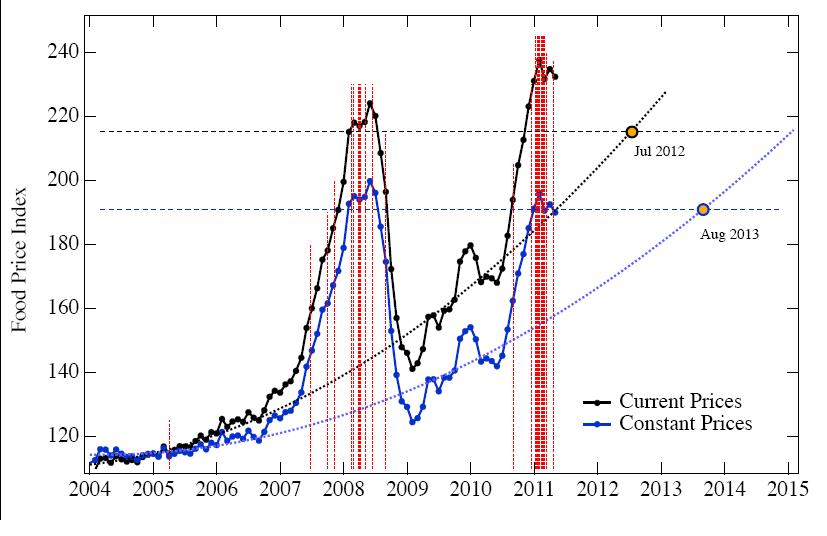 |
| Time dependence of FAO Price Index at current prices (upper black curve) and constant prices (corrected for inflation, lower blue curve) from January 2004 to May 2011. Red dashed vertical lines correspond to beginning dates of food riots and events associated with the major recent unrest in North Africa and the Middle East. Black and blue horizontal lines represent the price threshold above which riots are ignited in current and constant prices respectively. Index backgrounds are fitted with a third-order polynomial; intersection with the threshold (July 2012 at current prices, August 2013 at prices corrected for world inflation) represents the point of instability. Source: Marco Lagi, Karla Z. Bertrand and Yaneer Bar-Yam, "The Food Crises and Political Instability in North Africa and the Middle East", September 28, 2011; NECSI |


